

Analyzing force-time graphs on force plates can be a daunting task at first. However, developing a framework to interpret them can be incredibly valuable.
The countermovement jump (CMJ) is one of the most commonly performed tests on force plates in daily practice. To simplify the analysis, this discussion will focus on a hands-on-hips CMJ, serving as the foundation for understanding force-time graphs. Each jump generates a plethora of metrics, and determining what to focus on can feel overwhelming without a structured approach. For me, that approach begins with analyzing the shape of the graph itself. The graph’s shape provides valuable insights into an athlete's strengths, weaknesses, biomechanical inefficiencies, and even asymmetries in strength.
Phases of the CMJ
There are five main phases in a CMJ:
Unweighting
Braking
Propulsion
Flight
Landing
This article will focus on the three phases that occur before the athlete’s feet leave the force plate: unweighting, braking, and propulsion.
Components of the Force-Time Graph
The graph typically includes the following elements:
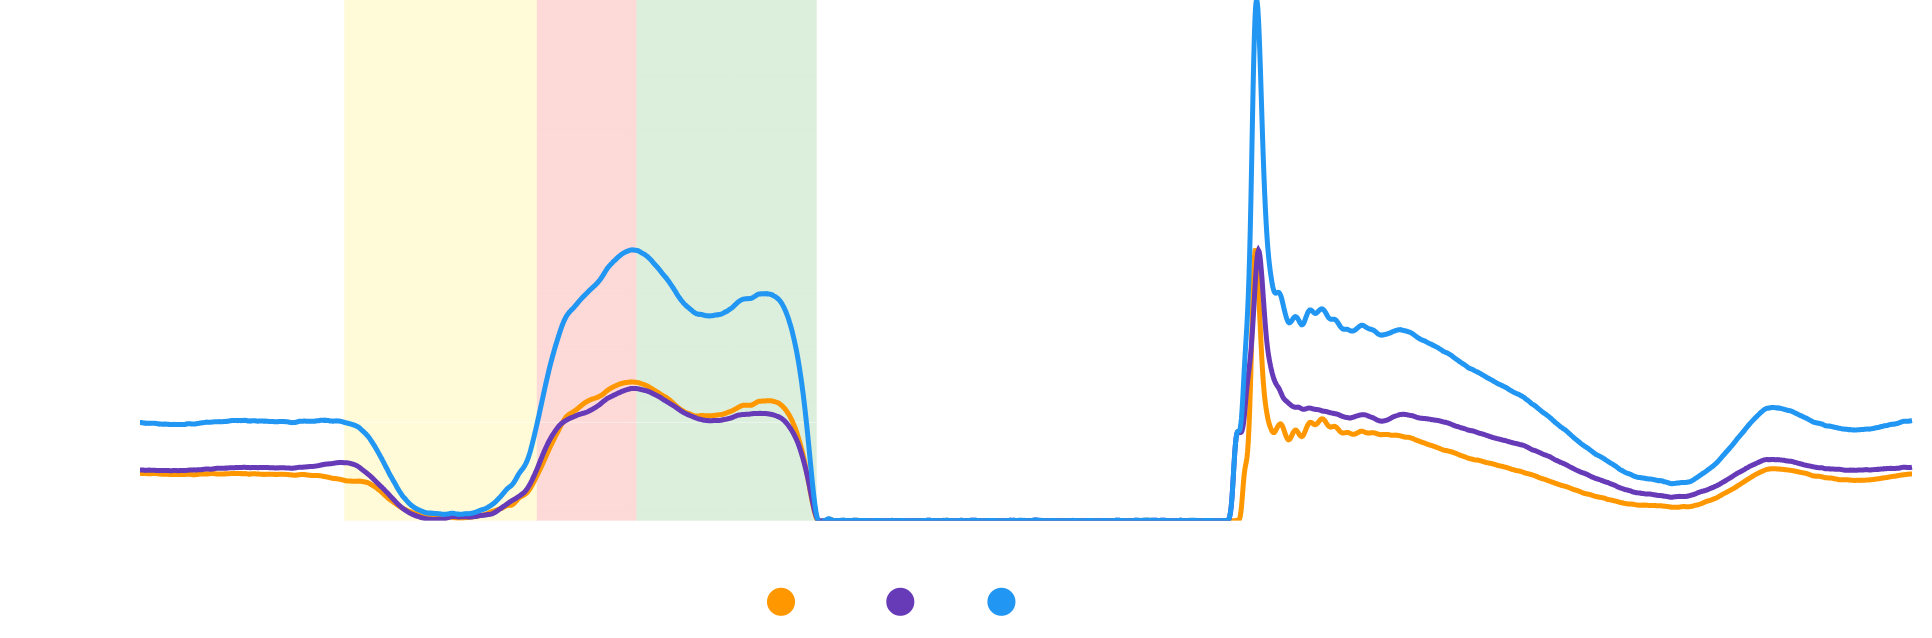
Blue Line: Represents the total ground reaction force (GRF) of the system.
Green Line: Indicates the velocity of the athlete’s center of mass.
Y-Axis: Force measured in newtons.
X-Axis: Time measured in seconds.
Purple and Orange Lines: Depict left and right GRF, which we won’t focus on for now.
Yellow Shaded Area: Unweighting Phase.
Red Shaded Area: Braking Phase.
Green Shaded Area: Propulsive Phase.
By breaking down the graph systematically, it becomes easier to interpret the data and identify key characteristics of the athlete’s performance.
Initial Steps in Graph Analysis
When analyzing a force-time graph, I follow a mental framework that allows me to understand what’s happening during the jump. While this article will not provide specific recommendations for training interventions or whether the shape is desirable (a topic for future articles), I hope it will help you become more aware of what you’re observing when viewing a force-time curve.
The diagram below broadly depicts my framework. The black numbers correspond to the step-by-step process listed below.
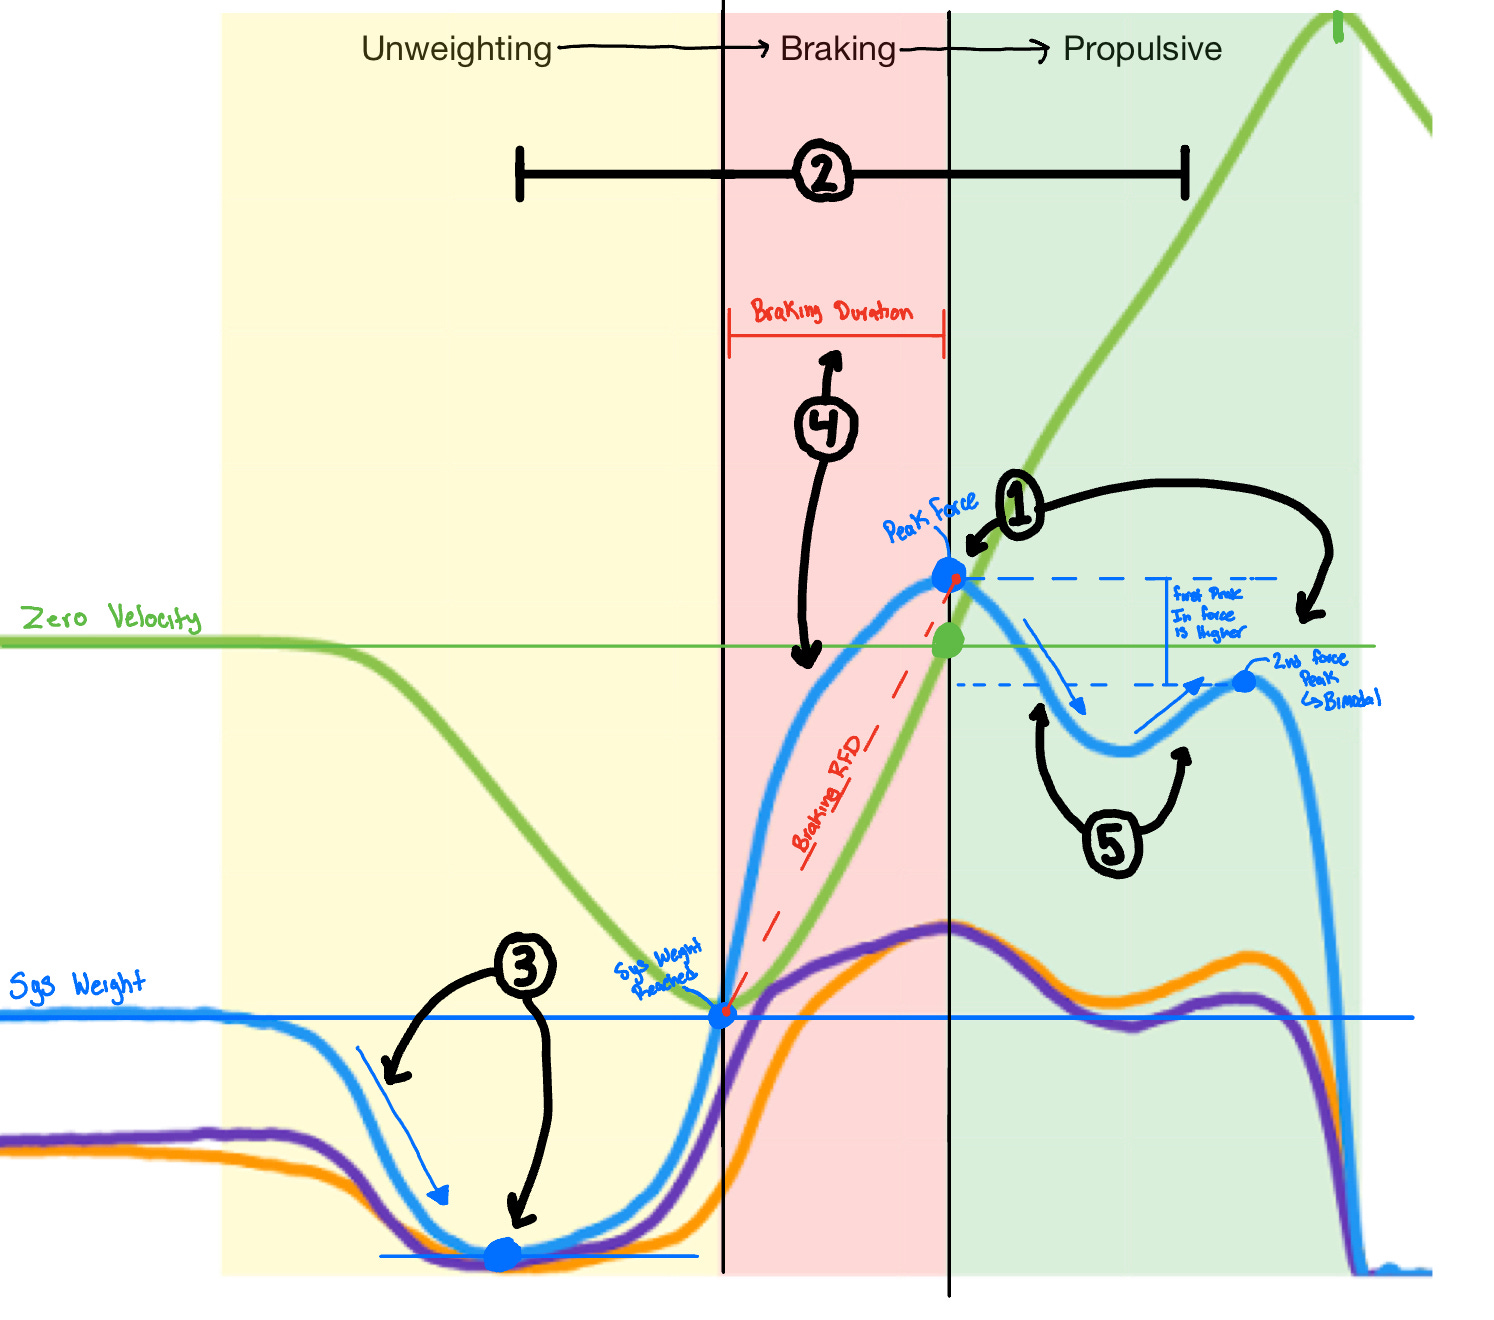
Identify Peak Force
Where does the blue line (total GRF) reach its highest point?
In which phase does this peak occur?
Are there multiple peaks? If so, is the highest peak first or last
?
Determine Graph Archetype
Force-time graphs can be categorized into archetypes based on the shape of the GRF curve, including:Early Peak Unimodal
Late Peak Unimodal
Early Peak Bimodal
Late Peak Bimodal
Early Peak Plateau
Late Peak Plateau
Plateau
Inconsistent
This is not an exhaustive list, but these archetypes are the ones I use to classify athletes. Understanding graph archetypes provides a broad picture of jump dynamics and forms the foundation for further analysis. More details on each archetype and its implications for training and performance will follow in future articles.
Phase-Specific Observations
Unweighting Phase
Does the athlete fully unweight their body weight?
Is there any instability during unweighting?
How steep is the unweighting phase?
Braking Phase
What is the duration of the braking phase?
How steep is the blue line (total GRF) during this phase?
Propulsion Phase
How steep is the upward slope of the blue line?
Are there any irregularities, such as secondary peaks or plateaus, during this phase?
This framework provides a starting point for analyzing CMJ force-time graphs. While it is not exhaustive, it offers a structured way to interpret the graph and identify key performance indicators. By understanding the graph’s shape and dynamics, practitioners can gain deeper insights into an athlete’s force production capabilities and refine their training interventions accordingly.